Processing

Widespread adoption of next generation sequencing (NGS) has led to an exponential increase in cataloged sequence data. One consequence of this has been a dramatic increase in the overall number of identified single nucleotide polymorphisms (SNPs; see sidebar, SNPs—defined, below). As of November 7, 2016, Build 149 of the NCBI dbSNP reference database listed 558 million submitted SNPs (subSNP) for Homo sapiens, of which 154 million were referenced (refSNP) [1]. This represents a >19X increase in the number of subSNPs over 10 years (28 million subSNPs in 2006, Build 126); and an ~13X increase in the number of refSNPs (Figure 1).
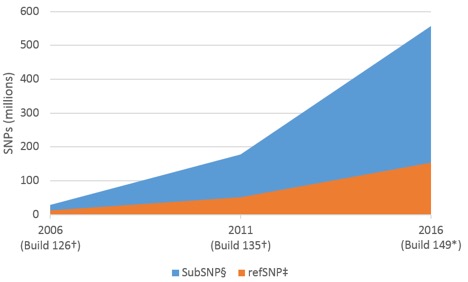
Figure 1. Dramatic increase in the number of human SNPs over the past 5 and 10 years.
* NCBI dbSNP Build 149 (Nov 7, 2016); www.ncbi.nlm.nih.gov/dbvar/content/org_summary/ (accessed Dec 19, 2016).
† www.ncbi.nlm.nih.gov/projects/SNP/snp_summary.cgi (accessed Dec 19, 2016).
‡ refSNP, or reference SNP cluster, is defined as a SNP or group of SNPs that map to a specific genomic sequence region. The SNPs of an existing build are all refSNPs. In creating a new build, the refSNPs from the prior build and new subSNPs are both compared to updated genome sequence data to minimize duplications among refSNPs and subSNPs. This process will assign subSNPs to existing refSNP clusters or new refSNPs.
§ subSNP stands for “submitted SNP” and is defined as a SNP submitted since the last build that was found to be distinct from refSNPs after multiple cycles of BLAST analyses.
Based on the number of refSNPs in Build 149, and a genome size of 3.4 x 10⁹ bp [2], the human genome should contain a SNP approximately once every 22 bases. Other common model systems show a similarly high frequency of SNPs (Table 1).
| Species | NCBI dbSNP build* | subSNP† (million) | refSNP‡ (million) | Genome size (bp)§ | SNPs per base |
|---|---|---|---|---|---|
| Homo sapiens (human) | Build 149 (Nov 7, 2016) | 557.9 | 154.2 | 3.40 x 10⁹ | 1 in 22 |
| Bos taurus (cow) | Build 148 (Jun 24, 2016) | 293.8 | 100.2 | 3.62 x 10⁹ | 1 in 36 |
| Mus musculus (mouse) | Build 146 (Nov 24, 2015) | 135.7 | 80.4 | 3.23 x 10⁹ | 1 in 40 |
| Sus scrofa (pig) | Build 145 (Jul 31, 2015) | 135.5 | 60.4 | 3.13 x 10⁹ | 1 in 52 |
| Drosophila melanogaster (fruit fly) | Build 148 (Jun 24, 2016) | 5.2 | 5.2 | 0.176 x 10⁹ | 1 in 34 |
* Taken from NCBI dbSNP; www.ncbi.nlm.nih.gov/dbvar/content/org_summary/(accessed Dec 19, 2016).
† subSNP stands for “submitted SNP” and is defined as a SNP submitted since the last build that was found to be distinct from refSNPs after multiple cycles of BLAST analyses.
‡ refSNP, or reference SNP cluster, is defined as a SNP or group of SNPs that map to a specific genomic sequence region. The SNPs of an existing build are all refSNPs. In creating a new build the refSNPs from the prior build and new subSNPs are both compared to updated genome sequence data to minimize duplications among refSNPs and subSNPs. This process will assign subSNPs to existing refSNP clusters or new refSNPs.
§ Gregory, T.R. (2005). Animal Genome Size Database; www.genomesize.com (accessed Dec 19, 2016); where genome size (bp) = (0.978 x 10⁹) x DNA content (pg)
Taking SNPs into account when designing PCR/qPCR assays
Given the high frequency of SNP occurrence, it is unrealistic to try to avoid SNPs altogether when designing your PCR/qPCR assays. However, it is important to consider their positioning, if located within a primer or probe sequence. Performing PCR using primers and probe sequences that overlie SNP sites can either dramatically impact a reaction or can have little to no impact at all. Specifically, the position of SNPs underlying a primer or probe can influence primer and probe melting temperature (Tm), efficiency of polymerase extension (non-proofreading polymerases like Taq), and even target affinity. To obtain the best data, it is important to know how your assay designs overlie SNPs and manage this positioning.
Positional effects. SNPs that occur in primer and/or probe binding sites can destabilize oligonucleotide binding and reduce target specificity. Mismatches can affect the hybridization of oligos, reducing the Tm of an oligonucleotide by as much as 5–18°C (Figure 2). The degree of effect on Tm depends on the mismatch position, type of mismatch (e.g., A/A, A/C, G/T), and the surrounding environment/sequence [3]. When probes hybridize, the destabilizing effects are highest for mismatches located in the interior of the duplex [4–6]. Mismatches at the terminus or penultimate position (1 or 2 base pairs from the terminus) are less discriminatory [4,7]. Use the free, online IDT OligoAnalyzer™ Tool to make such predictions.

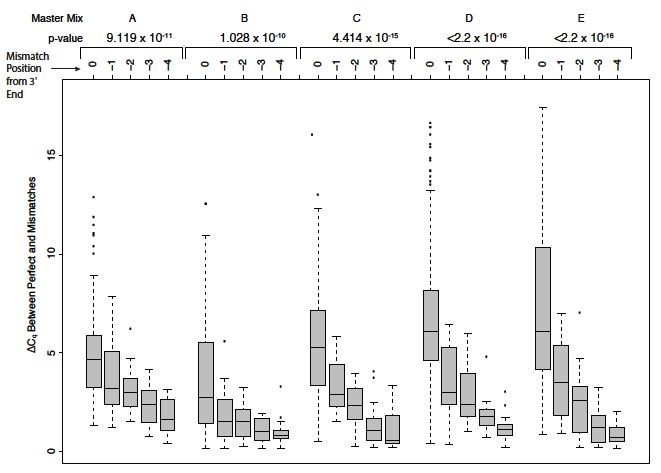
Base composition effects. Lefever and colleagues [8] also showed that reactions containing purine/purine and pyrimidine/pyrimidine mismatches at the 3’ terminal position in the primer produced larger Cq values (mismatch vs. perfect match) and reduced end-point fluorescence values, with A/G and C/C showing the largest Cq differences compared to perfect matches.
Their data demonstrated that the shift in Cq between a perfect-matched oligo/target and an oligo/target with a single mismatch decreased with increasing distance of the mismatch from the 3’ end [8]. Single mismatches located more than 5 nucleotides from the 3’ end could still have a moderate effect on qPCR amplification. Further experiments by this group showed that the reduction in Tm and shift in Cq were exacerbated when SNPs were present in both primers (forward and reverse) or when more than one mismatch occurs within a given primer [8].
The free, online OligoAnalyzer tool allows researchers to set mismatches and then calculate Tm. Users can examine potential hairpin and dimer formation using this tool. The DECODED article, Determining the physical characteristics of your oligos—The OligoAnalyzer Tool, provides guidance on how to identify these characteristics.
Effect on qPCR amplification. In many cases, a single SNP may not prevent amplification but can cause inefficient annealing and amplification [4]. This can lead to a delay shift in Cq and an underestimation of the amount of gene expression or even copy number loss in SNP-containing sequences.
Using a modified single-base extension assay, Wu and colleagues [9] investigated how the type and position of a mismatch affected extension efficiency during the initial PCR cycle. They concluded that mismatches within the last 3–4 bases of the 3’ end of the primer blocked primer extension. Wu et al. attributed the low extension efficiency to reduced binding of the DNA polymerase. While other research groups have contested this finding, describing a similar affinity of DNA polymerase for correctly paired and mispaired duplexes [10], Lefever and colleagues [8] confirm and extend the results from Wu et al.
Safeguard your experiments
Researchers often adopt primer and probe sequences identified in prior publications. It can be tempting to use legacy published or “lab-validated” RT-PCR assay designs. However, given the continual addition of new sequence information, it is important to reevaluate and understand the location of SNPs relative to primer and probe sequences in your PCR/qPCR assays. The following are tips for managing SNP impact on your assay results:
- To obtain an up-to-date list of possible SNPs in your sequence, scroll down to the Alignments section of your BLAST search results page, and click on Graphics at the top left. At the top right of the sequence graphic, click on Tracks and select the Variation tab. From there you can select the type of SNPs for which you want information.
- If the “rs” number—the Reference SNP cluster ID (accession number) that refers to a specific SNP—is known, check SNP information in NCBI dbSNP.
- If a SNP is identified, check whether the frequency of the SNP (minor allele frequency, or MAF) is relevant in your population.
- When you cannot avoid a SNP underlying your probe sequence, use the free, online IDT OligoAnalyzer Tool to predict the Tm of mismatched probe sequences.
- In cases where a SNP underlies a primer sequence, minimize SNP effects by positioning the SNP towards the 5’ end of the primer. For help with such designs, contact us.
- For genotyping experiments where relevant SNPs occur adjacent to your SNP of interest, avoid allele dropout by using mixed bases (Ns) or inosines in the primer or probe to cover the adjacent site(s). Since genomic information is constantly in flux, it is important to recheck previously used primer and probe sequences for underlying SNPs.
Adopting a new paradigm in assay design
SNPs are now a regular occurrence, with more discovered every day. It is no longer practical, or even possible, to avoid them when designing PCR/qPCR assays. This means we must adjust our thinking about experimental design, and design our PCR/qPCR assays intelligently, with SNPs in mind.